How to Humanize AI Text and Avoid Turnitin's AI Detector


Are you spending countless hours navigating complex datasets, feeling buried under a mountain of spreadsheets? The world of statistical data analysis is undergoing a profound transformation.
Thanks to the power of Artificial Intelligence, tasks that once consumed days can now be completed in minutes with superior accuracy and deeper insight.
This guide is your key to unlocking that potential. Whether you are a seasoned data scientist, a business analyst, or a researcher, the right AI tool will redefine your workflow. We will explore the top 10 AI platforms that are actively helping to clean data, identify hidden patterns, and generate clear, actionable insights.
Listen to a 3-minute audio summary of the key AI tools revolutionizing statistical data analysis.
Are you drowning in spreadsheets and complex datasets? Statistical data analysis doesn't have to be overwhelming anymore.
Thanks to cutting-edge AI tools, what once took days can now be accomplished in minutes – with even greater accuracy and insight. According to recent studies on AI data analysis, organizations using AI-powered statistical tools see up to a 65% reduction in analysis time.

"The right AI tool can reduce analysis time by up to 80% while revealing insights that would otherwise remain hidden." - Data Science Quarterly
AI-powered tools address the limitations of traditional statistical methods in remarkable ways:
AI-powered solutions streamline the traditionally disconnected statistical workflow into an efficient, integrated experience.
Traditional Workflow
|
AI-Enhanced Workflow
|

After thorough research, we've identified the top 10 AI tools that are revolutionizing statistical data analysis.

Julius AI stands out by bridging traditional methods with AI capabilities. Its user-friendly interface makes complex operations accessible while generating transparent Python code for review.
✅ Generates transparent Python code
✅ Self-correcting capabilities
⚠️ Paid subscription required
⚠️ R integration not yet available

Domo is a comprehensive end-to-end data platform that incorporates AI throughout the data journey, powerful for business users and large organizations.
✅ Comprehensive end-to-end solution
✅ Strong governance and security
⚠️ Higher cost
⚠️ Steeper learning curve
Azure ML facilitates the building, deployment, and management of high-quality machine learning models at scale, integrating seamlessly with other Microsoft products.
✅ Enterprise-grade security
✅ Seamless Microsoft integration
⚠️ Complex for simple needs
⚠️ May require Azure expertise
Tableau is a leading business intelligence platform now enhanced with AI features like Tableau GPT, making it more intuitive while maintaining powerful visualization capabilities.
✅ Industry-leading visualizations
✅ Seamless Salesforce integration
⚠️ High cost for enterprise versions
⚠️ Limited AI customization

PowerDrill AI is a specialized tool focused on making data analysis faster through AI assistance, providing comprehensive insights with visualizations and recommendations.
✅ High-quality visualizations
✅ Provides strategic recommendations
⚠️ Newer platform
⚠️ Limited integration options
ChatGPT has emerged as a surprisingly powerful tool for statistical data analysis, able to process raw data, perform analysis, and create interactive visualizations.
✅ Highly versatile and accessible
✅ Interactive visualizations
⚠️ Not specialized for statistics
⚠️ Premium subscription required
IBM Watson excels at text analytics and analyzing unstructured content across enterprise repositories, valuable for businesses with diverse data sources.
✅ Enterprise-grade capabilities
✅ Excellent text analytics
⚠️ Complex interface
⚠️ Significant investment required
KNIME is an open-source, low-code analytics platform that uses a modular data pipelining concept, making it accessible to users with varying levels of technical expertise.
✅ Open-source with no cost barriers
✅ Visual workflow builder
⚠️ Interface can feel dated
⚠️ Performance challenges with large datasets
Google Cloud provides a flexible, open, and secure data analytics platform built on Google's technology, leveraging services like BigQuery and Vertex AI.
✅ Scalable cloud-based solution
✅ Powerful BigQuery engine
⚠️ Cost can scale with usage
⚠️ Requires cloud expertise

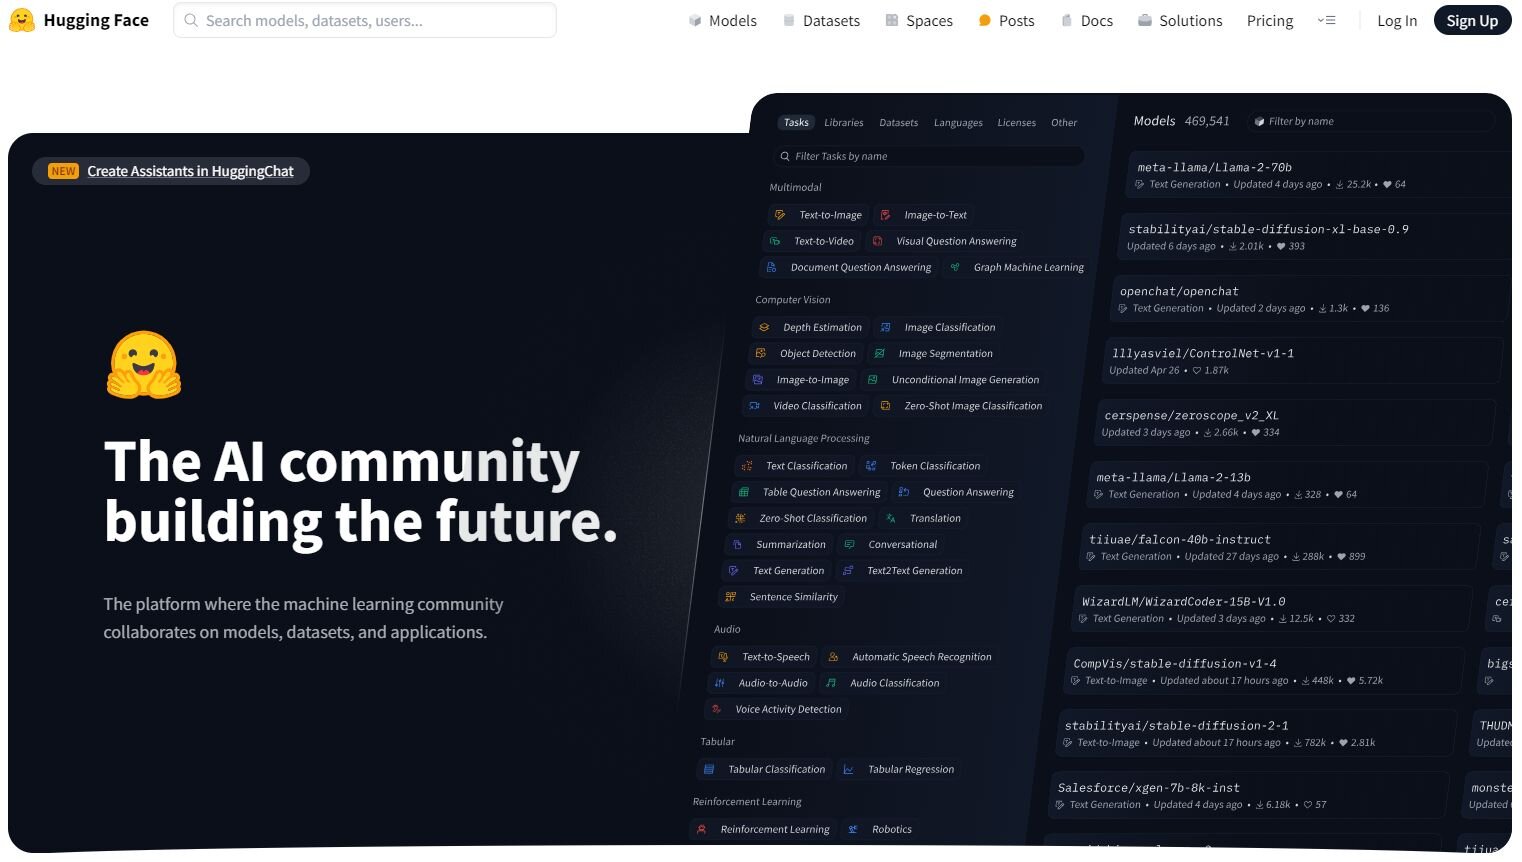
Hugging Face is an open-source hub that democratizes access to over 170,000 pre-trained models, making it a favorite among researchers who need flexible access to state-of-the-art models.
✅ Vast library of pre-trained models
✅ Open-source and community-driven
⚠️ Requires programming knowledge
⚠️ Less business-oriented
| Tool | Best For | User Level | Unique Feature |
|---|---|---|---|
| Julius AI | Academic research | Intermediate | Self-correcting analysis |
| Domo | Business intelligence | All levels | End-to-end platform |
| Azure ML | Enterprise ML | Advanced | MLOps capabilities |
| Tableau with AI | Data visualization | All levels | Industry-leading visualizations |
| PowerDrill AI | Business analysis | Beginner to Intermediate | Strategic recommendations |
| ChatGPT (GPT-4) | Versatile analysis | All levels | Interactive visualizations |
| IBM Watson | Text analytics | Advanced | Text analytics |
| KNIME | Visual workflow building | All levels | Visual workflow builder |
| Google Cloud | Large-scale analytics | Advanced | BigQuery integration |
| Hugging Face | Research, custom ML models | Advanced | 170,000+ pre-trained models |
Selecting the right tool can be challenging. Here's a framework to help you decide:
What is your primary goal?
For complex modeling, consider Julius AI. For BI and visualization, look at Tableau.
What is your technical expertise?
For non-programmers, PowerDrill AI or ChatGPT are great. For coders, Hugging Face offers more flexibility.
What is your budget?
Consider open-source options like KNIME. Enterprise solutions like Domo require significant investment.
Do you need integration with existing systems?
If you use Microsoft or Google ecosystems, their respective tools offer smoother integration.
How important is visualization?
For presentation-quality visuals, Tableau stands out. For interactive exploration, try ChatGPT.
Once you've selected a tool, a structured approach will help you maximize its value:
The AI analysis landscape continues to evolve. Key trends to watch include:
AI tools have transformed statistical analysis into an accessible, efficient process. The 10 tools we've explored represent the cutting edge of this revolution. By thoughtfully incorporating them into your workflow, you can dramatically enhance both efficiency and insight quality, unlocking new value from your data.
Choose one of the powerful AI tools from our guide and start transforming your data into actionable insights today. Elevate your research and unlock the full potential of your data.
AI tools complement rather than replace statisticians. Human expertise remains essential for framing research questions, selecting methodologies, and interpreting results in context.
They can be highly accurate, but this depends on data quality and proper interpretation. The best tools provide transparency, allowing for verification. Always validate critical findings.
R was designed specifically for statistics and offers more specialized packages. Python is a general-purpose language with excellent data science libraries and better integration with production systems.
Yes. KNIME is a powerful open-source tool. The free tier of ChatGPT can handle many analyses. Hugging Face provides access to numerous open-source models.
It varies. Tools like ChatGPT and Julius AI require minimal programming. Tableau and Domo use visual interfaces. Hugging Face and Azure ML are better for users comfortable with code.
Modern tools can perform a wide range, including descriptive statistics, hypothesis testing, regression, time series analysis, clustering, and classification.
Review the provider's privacy policy, anonymize sensitive data before upload, and use enterprise versions with stronger security for sensitive information.
Enterprise solutions like Google Cloud and Azure ML are built for very large datasets. Cloud-based platforms generally handle large data better than desktop applications.
SaaS tools like ChatGPT and Julius AI update continuously. Enterprise platforms like Domo and Tableau typically follow quarterly or monthly release cycles.
Comments
Post a Comment